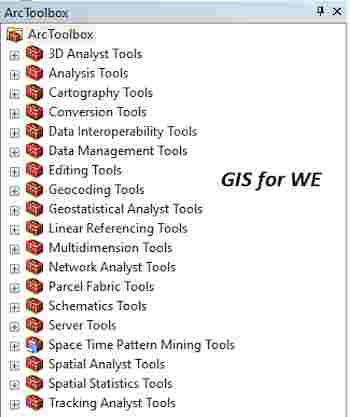
Zonal Geometry as Table, Zonal Histogram Tools
Zonal Geometry as Table
أداة هندسة المنطقة كجدول
ArcMap
ArcGIS
How to use Zonal Geometry as Table Tool in Arc Toolbox??
كيفية استخدام أداة هندسة المنطقة كجدول ؟؟
Path to access the toolمسار الوصول الى الأداة
:
Zonal Geometry as Table Tool, Zonal Toolset, Spatial Analyst Tools Toolbox
Zonal Geometry as Table
Calculates the geometry
measures (area, perimeter, thickness, and the characteristics of ellipse) for
each zone in a dataset and reports the results as a table.
لحساب المقاييس الهندسية (المنطقة ، والمحيط ،
والسمك ، وخصائص القطع الناقص) لكل منطقة في مجموعة البيانات والإبلاغ عن النتائج
في شكل جدول.
1.
Input raster or feature zone data إدخال
البيانات النقطية أو منطقة المعلم
Dataset that defines the
zones.
The zones can be defined
by an integer raster or a feature layer.
مجموعة البيانات التي تحدد المناطق.
يمكن تحديد المناطق بواسطة عدد صحيح نقطي أو طبقة
معالم.
2.
Zone field حقل المنطقة
Field that holds the
values that define each zone.
It must be an integer
field of the zone dataset.
الحقل الذي يحتوي على القيم التي تحدد كل منطقة.
يجب أن يكون حقل عدد صحيح لمجموعة بيانات المنطقة.
3.
Output table الجدول المخرج
Output table that will
contain the summary of the values in each zone.
The format of the table
is determined by the output location and path. By default, the output will be a
geodatabase table. If the path is not in a geodatabase, the format is
determined by the extension. If the extension is .dbf, it will be in dBASE
format. If no extension is specified, the output will be an INFO table.
جدول الإخراج الذي سيحتوي على ملخص القيم في كل
منطقة.
يتم تحديد تنسيق الجدول من خلال موقع الإخراج
والمسار. بشكل افتراضي ، سيكون الناتج جدول قاعدة بيانات جغرافية. إذا لم يكن
المسار موجودًا في قاعدة بيانات جغرافية ، فسيتم تحديد التنسيق بواسطة الامتداد.
إذا كان الامتداد .dbf ، فسيكون بتنسيق dBASE. إذا
لم يتم تحديد امتداد ، فسيكون الإخراج جدول INFO.
4.
Processing cell size (optional) حجم
خلية المعالجة (اختياري)
The cell size of the
output raster that will be created.
This parameter can be
defined by a numeric value or obtained from an existing raster dataset. If the
cell size hasn't been explicitly specified as the parameter value, the
environment cell size value will be used if specified; otherwise, additional
rules will be used to calculate it from the other inputs. See the usage for
more detail.
حجم خلية البيانات النقطية الناتجة التي سيتم إنشاؤها.
يمكن تحديد هذه المعلمة بقيمة عددية أو الحصول عليها من مجموعة بيانات نقطية موجودة. إذا لم يتم تحديد حجم الخلية بشكل صريح كقيمة المعلمة ، فسيتم استخدام قيمة حجم خلية البيئة إذا تم تحديدها ؛ خلاف ذلك ، سيتم استخدام قواعد إضافية لحسابها من المدخلات الأخرى. انظر الاستخدام لمزيد من التفاصيل.
Zonal Histogram
أداة الرسم البياني للمنطقة
ArcMap
ArcGIS
How to use Zonal Histogram Tool in Arc Toolbox??
كيفية استخدام أداة الرسم البياني للمنطقة ؟؟
Path to access the toolمسار الوصول الى الأداة
:
Zonal Histogram Tool, Zonal
Toolset, Spatial Analyst Tools Toolbox
Zonal Histogram
Creates a table and a
histogram graph that show the frequency distribution of cell values on the
Value input for each unique Zone.
ينشئ جدولاً ورسم بياني مدرج تكراري يوضح توزيع
التردد لقيم الخلية على إدخال القيمة لكل منطقة فريدة.
1.
Input raster or feature zone data إدخال
البيانات النقطية أو منطقة الميزة
Dataset that defines the
zones.
The zones can be defined
by an integer raster or a feature layer.
مجموعة البيانات التي تحدد المناطق.
يمكن تحديد المناطق بواسطة عدد صحيح نقطي أو طبقة
معالم.
2.
Zone field حقل المنطقة
Field that holds the
values that define each zone.
It can be an integer or
a string field of the zone dataset.
الحقل الذي يحتوي على القيم التي تحدد كل منطقة.
يمكن أن يكون عددًا صحيحًا أو حقل سلسلة لمجموعة
بيانات المنطقة.
3.
Input value raster ادخل قيمة
البيانات النقطية
The raster values to
create the histograms.
القيم النقطية لإنشاء الرسوم البيانية.
4.
Output table الجدول المخرج
The output table file.
The format of the table
is determined by the output location and path. By default, the output will be a
geodatabase table. If the path is not in a geodatabase, the format is
determined by the extension. If the extension is .dbf, it will be in dBASE
format. If no extension is specified, the output will be an INFO table.
The optional graph
output is created from the information in the table.
ملف جدول الإخراج.
يتم تحديد تنسيق الجدول من خلال موقع الإخراج
والمسار. بشكل افتراضي ، سيكون الناتج جدول قاعدة بيانات جغرافية. إذا لم يكن
المسار موجودًا في قاعدة بيانات جغرافية ، فسيتم تحديد التنسيق بواسطة الامتداد.
إذا كان الامتداد .dbf ، فسيكون بتنسيق dBASE. إذا
لم يتم تحديد امتداد ، فسيكون الإخراج جدول INFO.
يتم إنشاء مخرجات الرسم البياني الاختيارية من
المعلومات الموجودة في الجدول.
5.
Output graph name (optional) اسم
الرسم البياني الناتج (اختياري)
The name of the output
graph for display.
The graph is temporary.
To persist it, use the Save Graph tool.
اسم الرسم البياني الناتج للعرض.
الرسم البياني مؤقت. للاستمرار في ذلك ، استخدم أداة Save Graph.
اليك صفحه ومجموعة على الفيس بوك لتعلم أكثر بما يخص نظم المعلومات الجغرافية (GIS) و برنامج ArcGIS Pro من خلال هذه الروابط:


Jackpot City Casino Site » Online Slots, Live Casino, and Table Games
ردحذفJackpot City is a Microgaming company that is headquartered 카지노사이트luckclub in Cyprus and is headquartered in United Kingdom, Gibraltar, Malta and Malta.