Compute Dirty Area and Mosaic Candidates Tools
Compute Dirty Area
أداة حساب المنطقة
الوسخة
ArcMap ArcGIS
How to Compute Dirty Area Tool in Arc Toolbox ArcMap ArcGIS??
كيفية استخدام أداة حساب المنطقة الوسخةArc Toolbox ArcMap ArcGIS ؟؟
Path
to access the toolمسار الوصول الى الأداة
:
Compute
Dirty Area Tool, Mosaic Dataset Toolset,
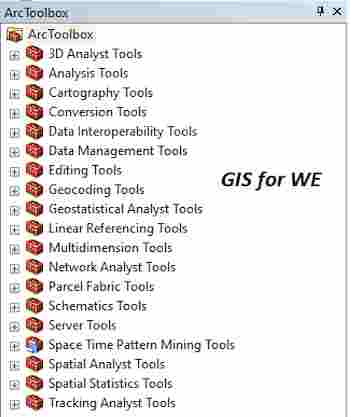
Raster Box, Data Management Tools Toolbox
Compute Dirty Area
Identifies areas within
a mosaic dataset that have changed since a specified point in time. This is
used commonly when a mosaic dataset is updated or synchronized, or when derived
products, such as cache, need to be updated. This tool will enable you to limit
such processes to only the areas that have changed.
يحدد المناطق داخل مجموعة بيانات دمج الصور التي
تغيرت منذ نقطة زمنية محددة. يستخدم هذا بشكل شائع عند تحديث مجموعة بيانات دمج
الصور أو مزامنتها ، أو عند الحاجة إلى تحديث المنتجات المشتقة ، مثل ذاكرة
التخزين المؤقت. ستمكنك هذه الأداة من قصر هذه العمليات على المناطق التي تغيرت
فقط.
1.
Mosaic Dataset مجموعة بيانات دمج
الصور
The mosaic dataset that
you want to analyze for changes.
مجموعة بيانات دمج الصور التي تريد تحليلها لمعرفة
التغييرات.
2.
Query Definition (optional) تعريف
الاستعلام (اختياري)
SQL expression to select
specific rasters within the mosaic dataset on which to compute dirty areas.
تعبير SQL
لتحديد البيانات النقطية المحددة ضمن مجموعة بيانات دمج الصور التي يتم من خلالها
حساب المناطق المتسخة.
3.
Start Date and Time تاريخ ووقت
البدء
Compute the areas that
have changed since the input time.
XML time syntax:
·
YYYY-MM-DDThh:mm:ss
·
YYYY-MM-DDThh:mm:ss.ssssZ
·
2002-10-10T12:00:00.ssss-00:00
·
2002-10-10T12:00:00+00:00
Non-XML time syntax:
·
2002/12/25 23:59:58.123
احسب المناطق التي تغيرت منذ وقت الإدخال.
بناء جملة وقت XML
بناء جملة وقت غير XML
4.
Output Feature Class فئة ميزة
الإخراج
The feature class containing
the areas that have changed.
فئة المعالم التي تحتوي على المناطق التي تم
تغييرها.
Compute Mosaic Candidates
أداة حساب المشاركين
في دمج الصور
ArcMap ArcGIS
How to Compute Mosaic
Candidates Tool in Arc Toolbox ArcMap ArcGIS??
كيفية استخدام أداة حساب المشاركين في دمج الصورArc Toolbox ArcMap ArcGIS ؟؟
Path
to access the toolمسار الوصول الى الأداة
:
Compute
Mosaic Candidates Tool, Mosaic Dataset Toolset, Raster Box, Data Management
Tools Toolbox
Compute Mosaic Candidates
Finds the image
candidates within in the mosaic dataset that best represents the mosaic area.
Densely overlapped
images are necessary in many projects but can cause uncertainty on which images
within the mosaic dataset should be used in your analysis. This tool can help
decide which images are optimal, based on areas of maximum overlap and maximum
amount of area excluded.
The input mosaic dataset
will include a new field named Candidate in the mosaic dataset footprint table.
This field determines which images are used in certain operations, such as
color balancing, seamline generation, ortho mapping, and mosaic methods.
يبحث عن الصور المرشحة داخل مجموعة بيانات دمج
الصور التي تمثل منطقة دمج الصور بأفضل شكل.
تعد الصور المتداخلة بكثافة ضرورية في العديد من
المشاريع ولكنها قد تسبب عدم اليقين بشأن الصور الموجودة ضمن مجموعة بيانات دمج
الصور التي يجب استخدامها في تحليلك. يمكن أن تساعد هذه الأداة في تحديد الصور
المثالية ، بناءً على مناطق التداخل القصوى والحد الأقصى للمساحة المستبعدة.
ستتضمن مجموعة بيانات دمج الصور المدخلة حقلاً
جديدًا يسمى المرشح في جدول البصمة لمجموعة بيانات دمج الصور. يحدد هذا الحقل
الصور التي يتم استخدامها في عمليات معينة ، مثل موازنة اللون ، وإنشاء خط التماس
، ورسم الخرائط ، وطرق دمج الصور.
1.
Input Mosaic Dataset أدخل مجموعة
بيانات دمج الصور
The input mosaic dataset
with densely overlapped images.
مجموعة بيانات دمج الصور المدخلة بصور متداخلة
بكثافة.
2.
Maximum Area Overlap (optional) أقصى
مساحة تداخل (اختياري)
The maximum amount of
overlap that you want between the mosaic dataset and the footprint of each
image in the mosaic dataset. If the percentage of overlap is higher than this
threshold, the image is excluded since it will have too much redundant
information.
The percentage is
expressed as a decimal. For example, a maximum overlap of 60 percent is
expressed as 0.6.
الحد الأقصى لمقدار التداخل الذي تريده بين مجموعة
بيانات دمج الصور وبصمة كل صورة في مجموعة بيانات دمج الصور. إذا كانت النسبة
المئوية للتداخل أعلى من هذه العتبة ، فسيتم استبعاد الصورة لأنها ستحتوي على
الكثير من المعلومات الزائدة عن الحاجة.
يتم التعبير عن النسبة المئوية في صورة عدد عشري.
على سبيل المثال ، يتم التعبير عن الحد الأقصى للتداخل بنسبة 60 بالمائة على أنه
0.6.
3.
Maximum Area Loss Allowed (optional) الحد الأقصى لخسارة المنطقة المسموح بها (اختياري)
This is the maximum
percentage of area that can be excluded by the candidate images. After the tool
chooses the best candidate images based on the Maximum Area Overlap, it will
then check to see if the maximum excluded area is below the threshold
specified. If the excluded area is greater than the specified threshold, the
tool will add more candidate images to fill in some of the voids that were
missing. Most of these excluded areas will likely be along the border of the
mosaic dataset.
The percentage is
expressed as a decimal. For example, a maximum excluded area of 5 percent is
expressed as 0.05.
هذه هي النسبة المئوية القصوى للمنطقة التي يمكن
أن تستبعدها الصور المرشحة. بعد أن تختار الأداة أفضل الصور المرشحة بناءً على
الحد الأقصى لتداخل المساحة ، ستقوم بعد ذلك بالتحقق لمعرفة ما إذا كان الحد
الأقصى للمنطقة المستبعدة أقل من الحد المحدد. إذا كانت المساحة المستبعدة أكبر من
الحد المحدد ، ستضيف الأداة المزيد من الصور المرشحة لملء بعض الفراغات المفقودة.
من المحتمل أن تكون معظم هذه المناطق المستبعدة على طول حدود مجموعة بيانات دمج
الصور.
يتم التعبير عن النسبة المئوية في صورة عدد عشري.
على سبيل المثال ، يتم التعبير عن أقصى مساحة مستبعدة بنسبة 5 بالمائة على أنها
0.05.
اليك صفحه ومجموعة على الفيس بوك لتعلم أكثر بما يخص نظم المعلومات الجغرافية (GIS) و برنامج ArcGIS Pro من خلال هذه الروابط:


تعليقات
إرسال تعليق